
The Beracha, Hardin and Johnson Housing Affordability Index, published quarterly, measures the affordability of residential properties in Miami-Dade, Broward and Palm Beach counties. The findings are based on average property prices relative to median household income (price divided by income) in each county, as well as average mortgage payments as a percentage of income (a payment divided by income).
Income data comes for the Federal Reserve. Mortgage rates are for borrowers with top tier credit with Freddie Mac as the source. For the payment-to-income calculations, the assumption is a 20 percent down payment and the payment includes principal and interest, but does not include any other housing expenses.
Q3 2019 | ||
Price/Income | Payment/Income | |
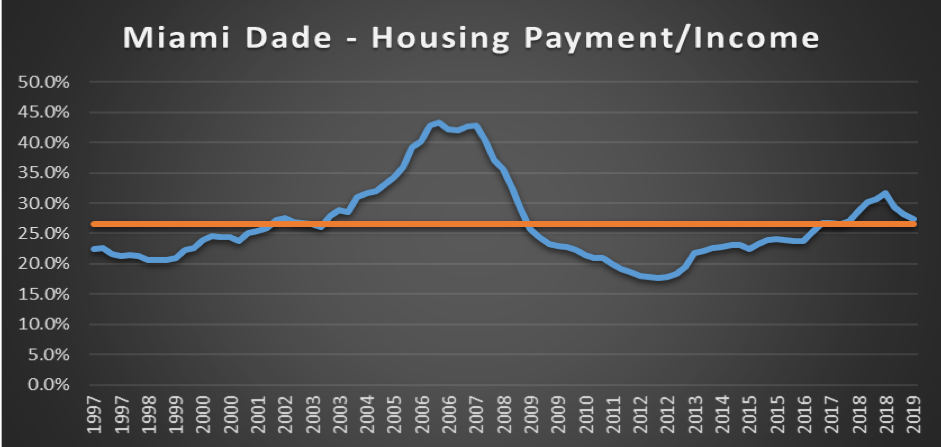
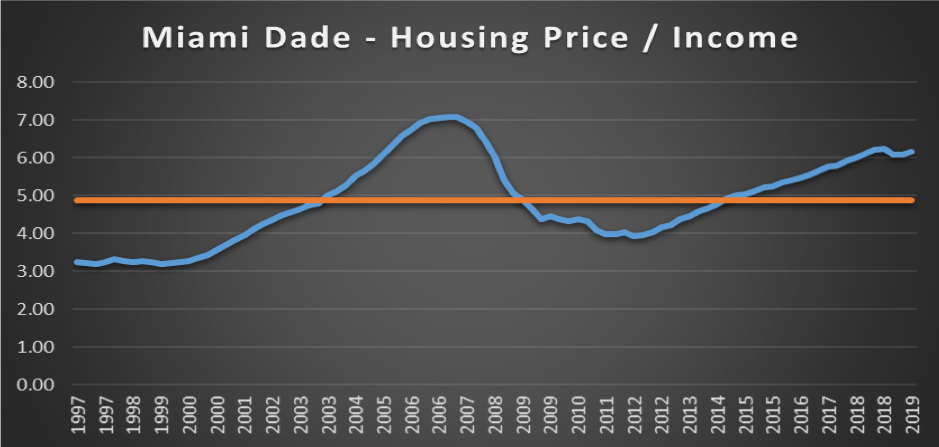
Miami-Dade | 6.17 | 27.4% |
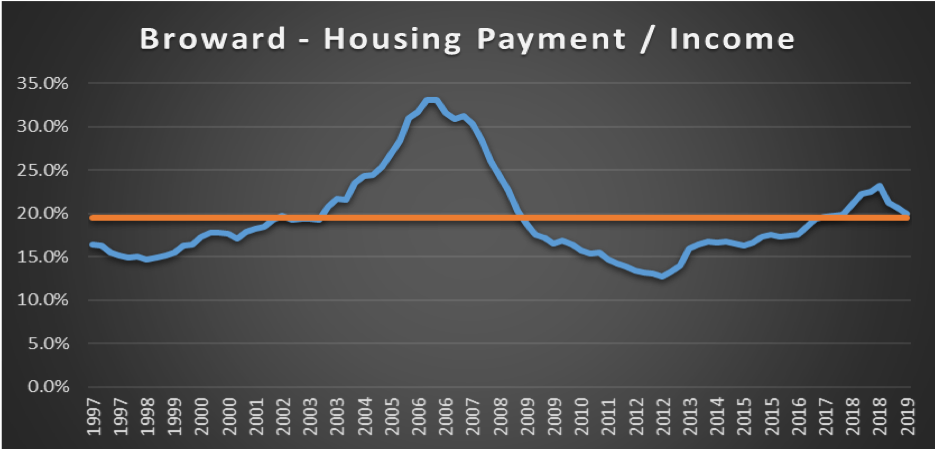
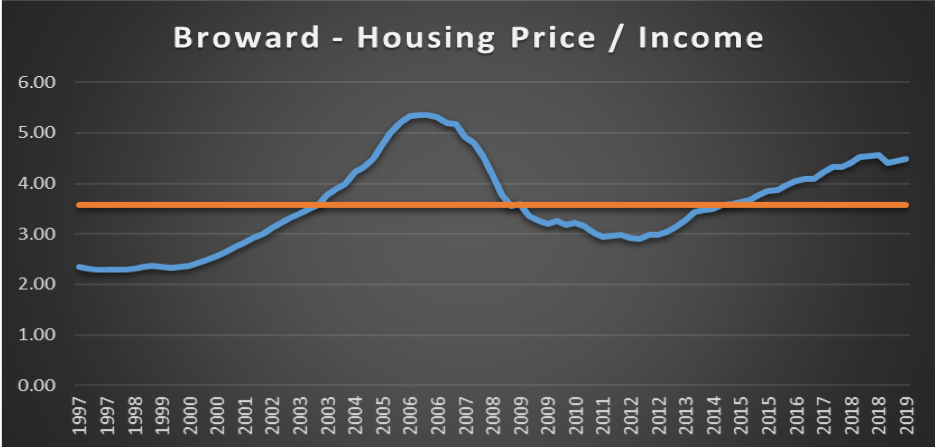
Broward | 4.49 | 19.9% |
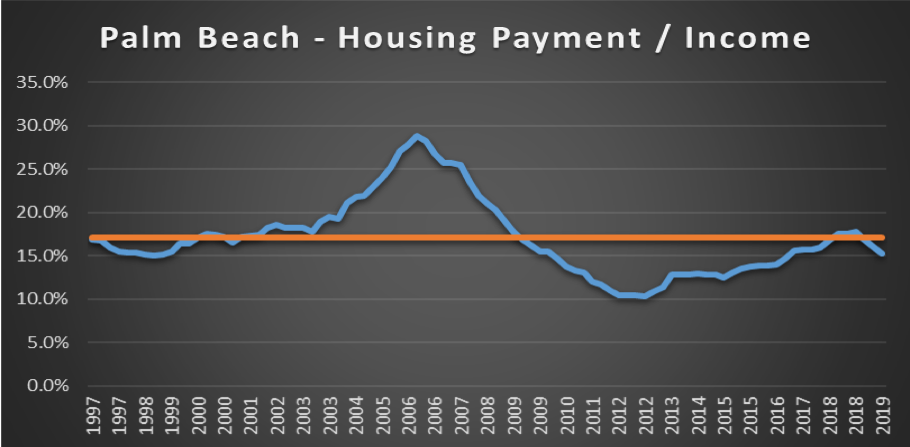
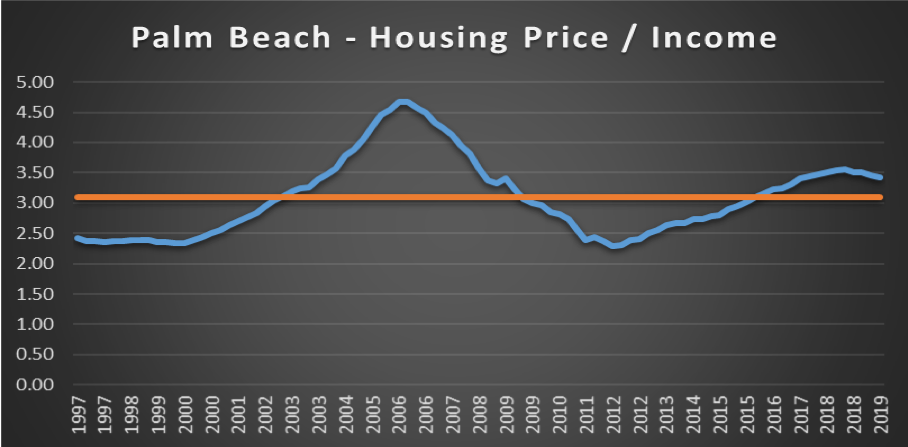
Palm Beach | 3.42 | 15.2% |
The charts below illustrate changes in housing price to income and housing payment to income from 1997 to 2019. The orange line represents the average value over that period. When the index score is above the line, housing is less affordable, on average, for he period. When the index score is below the line, housing is more affordable on average.
Current Summary
The numbers indicate that housing affordability across Miami-Dade, Broward and Palm Beach counties continues to improve. Improving affordability comes in the form of the percentage of income dedicated to housing payment and the average price to income (i.e. the property price multiple). That is, on average, across the three counties families are paying less for housing than in the recent past.
Beracha, Hardin and Johnson all agree the movement, in general, towards more affordable housing is driven by a combination of near record low mortgage rates, a robust local economy, and slowing property appreciation rates across the three counties. All expressed concern, however, over the fact that each county’s property price multiple is above its long-term average and worry that a change in economic conditions could quickly shift Southeast Florida back towards less affordability.
Q2 2019 | ||
Price/Income | Payment/Income | |
Miami-Dade | 6.08 | 28.1% |
Broward | 4.45 | 20.6% |
Palm Beach | 3.51 | 16.3% |
Q1 2019 | ||
Price/Income | Payment/Income | |
Miami-Dade | 6.07 | 29.4% |
Broward | 4.40 | 21.3% |
Palm Beach | 3.53 | 17.1% |
Q4 2018 | ||
Price/Income | Payment/Income | |
Miami-Dade | 6.23 | 31.6% |
Broward | 4.57 | 23.2% |
Palm Beach | 3.67 | 18.6% |
Q3 2018 | ||
Price/Income | Payment/Income | |
Miami-Dade | 6.21 | 30.7% |
Broward | 4.54 | 22.5% |
Palm Beach | 3.67 | 18.2% |
Q2 2018 | ||
Price/Income | Payment/Income | |
Miami-Dade | 6.1 | 30.10% |
Broward | 4.52 | 22.30% |
Palm Beach | 3.57 | 17.60% |
Q1 2018 | ||
Price/Income | Payment/Income | |
Miami-Dade | 6.01 | 28.70% |
Broward | 4.41 | 21.10% |
Palm Beach | 3.5 | 16.70% |
Q4 2017 | ||
Price/Income | Payment/Income | |
Miami-Dade | 5.92 | 27.10% |
Broward | 4.33 | 19.80% |
Palm Beach | 3.47 | 15.90% |
Q3 2017 | ||
Price/Income | Payment/Income | |
Miami-Dade | 5.8 | 26.50% |
Broward | 4.32 | 19.70% |
Palm Beach | 3.44 | 15.70% |
Q2 2017 | ||
Price/Income | Payment/Income | |
Miami-Dade | 5.77 | 26.70% |
Broward | 4.23 | 19.60% |
Palm Beach | 3.4 | 15.70% |